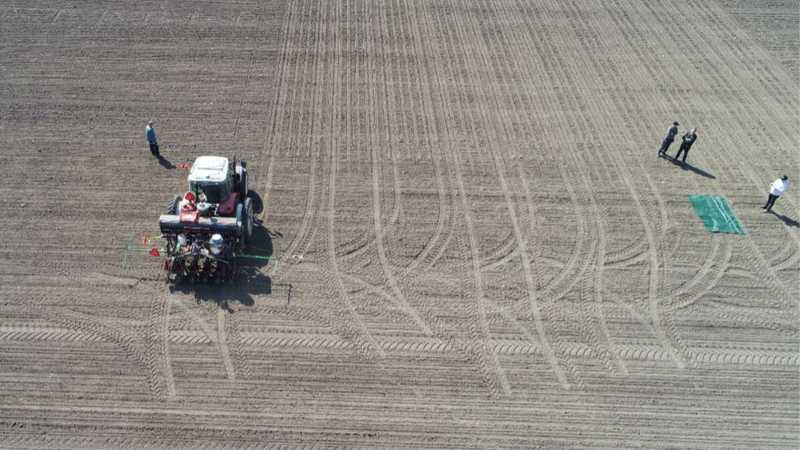
Digitizing Field Data in Sugar Beet Trials with Drones
February 09, 2022
Nordic Beet Research, the research and development organization of sugar beet growers and the sugar industry in Denmark and Sweden, conducts numerous sugar beet trials each year. Their goal is to advance the knowledge base on all aspects of sugar beet production for their growers and the sugar industry. In the last three years, drone imagery and data analytics have helped them improve plot inspection efficiency and increase data confidence for more objective and reliable conclusions
We wanted to have a record of each trial over the season to assist in assessing data quality,” said William English, Project Manager & Industrial Doctoral Candidate at NBR Nordic Beet Research Foundation. “We also wanted to see what other metrics we could get from the imagery to describe the phenotypes of the sugar beets in each plot.
Details
Crop: Sugar beet production trials
Location: Multiple sites in Skåne, Sweden and Lolland/Falster, Denmark
Farm size: 10,000 research plots
Partners: Nordic Beet Research (NBR)
Hardware: DJI Phantom 4 Pro, DJI Mavic Pro 2, DJI Mavic enterprise dual, DJI Mavic mini 2
Software: Solvi Plant Health Maps, Zonal Statistics, Plant Counts with PlantAI™
Flight Altitude: 10-30 meters AGL(Above Ground Level)
Number of flights: 200+ per season
Image resolution: 0.5-2 cm/px
Situation
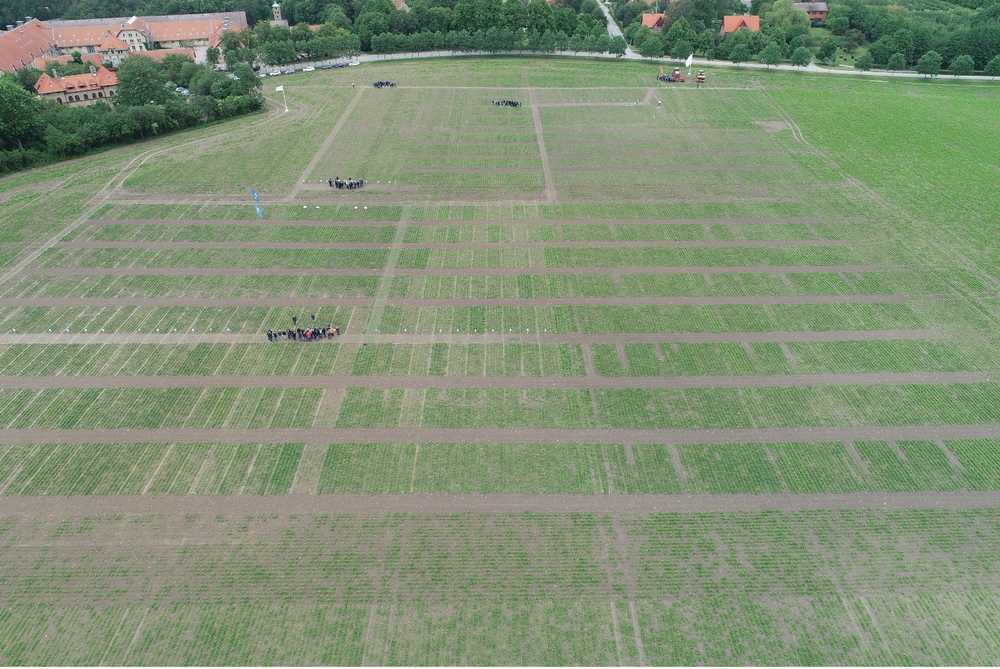
NBR manages over 80 trials per year spanning 10,000 research plots managed by teams in two countries. To properly assess each trial, all of the 16 square-meter plots are inspected weekly during the growing season (May - October) for analysis and record keeping. Data from each trial must be comparably collected and sharable with a ten-member, geographically dispersed team. No small task.
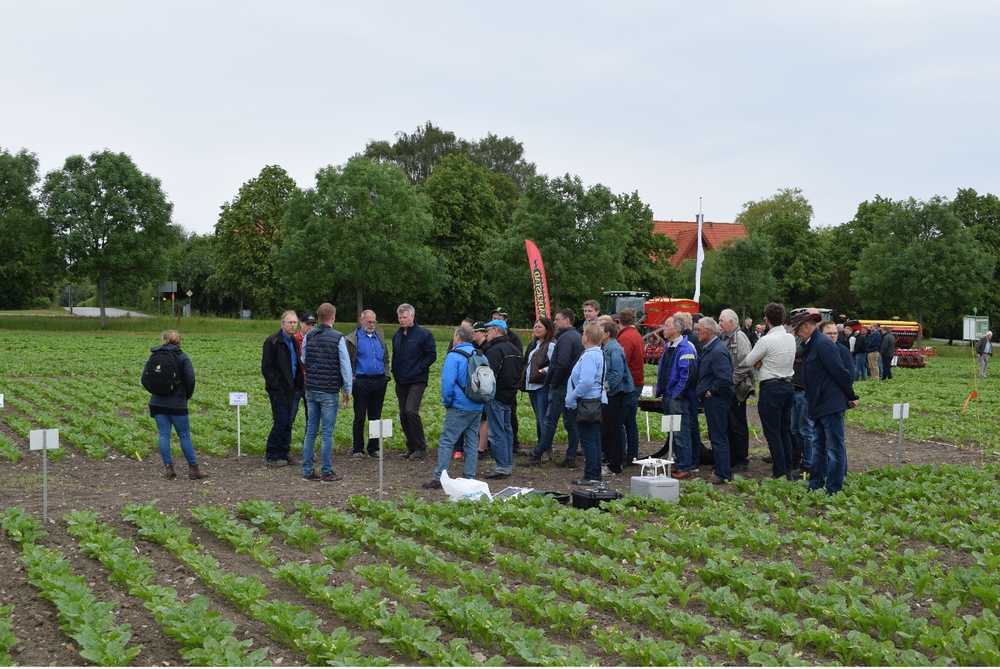
In the past, NBR collected anecdotal hand-written field observations and ground-view photography for each trial site. While necessary for documentation, the process was time consuming, inexact, and difficult to compare across seasons or sites.
The group turned to drone imagery to improve their field inspection efficiency, harmonize data reliability across sites, and uncover new metrics for varietal characterization and comparison.
Research Goals
- Objectively and comparatively evaluate research trials across multiple sites and seasons with a focus on:
- Improved establishment and yield potential by enhanced soil tillage
- Variety selection for increased potential
- Harvest and storage
- Seed treatments
- Sustainable control of fungi
- Integrated weed control
- Accurately describe and quantitatively document variety phenotype differences
- Catalog seasonal development for multi-year comparisons and to explain data anomalies.
- Share congruent data among team members and effectively communicate to stakeholders
Assessment Strategy
NBR’s team incorporated drone plot surveys to increase their inspection efficiency and data consistency. As new drone users, they had experimented with a more labor-intensive image capture system but found managing the volume of photos and the multi-step process to be cumbersome. They regrouped and sought an off-site data service to stitch and house their field images with clear plot delineations. A colleague in Denmark recommended Solvi.
Being able to refer back to drone images taken over the season is proving more reliable than just referring back to old notes taken from field visits,” English said. “It also allows us to see things that we might have otherwise missed – footprints from animals, an anomaly in the field, or an area that is prone to great water deficits. It makes our data more objective and reliable.
Download The Complete UAV Handbook for Agricultural Research
Learn how to establish a successful drone imaging program without a data scientist
Get your free pdfDrone Data Visualizations
1. Trial Plot Boundaries
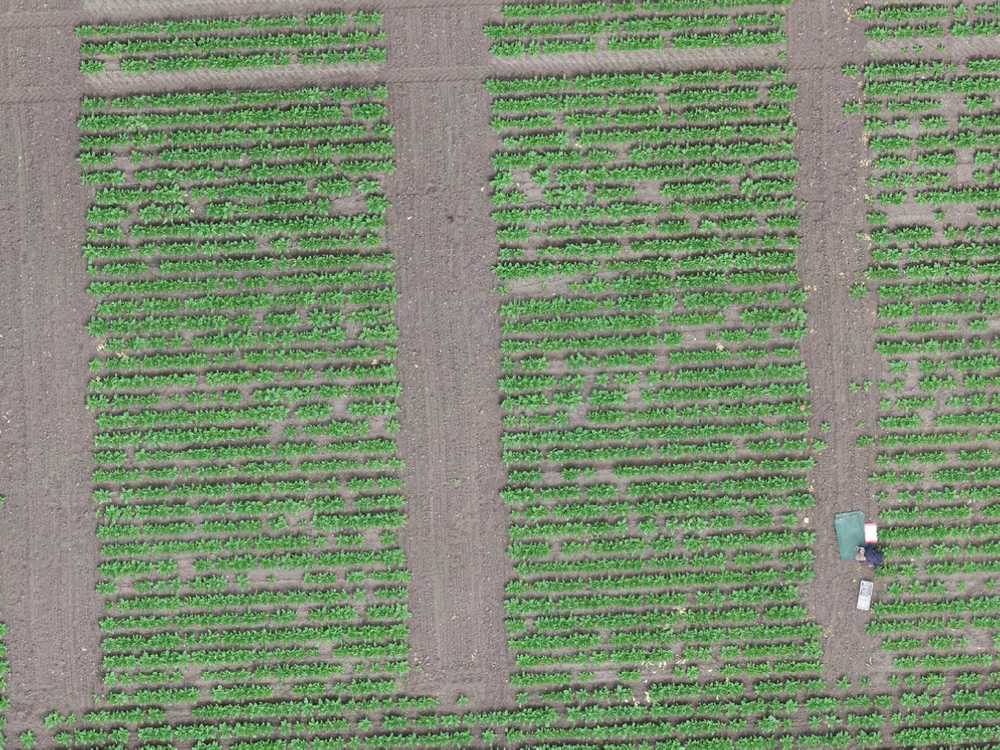
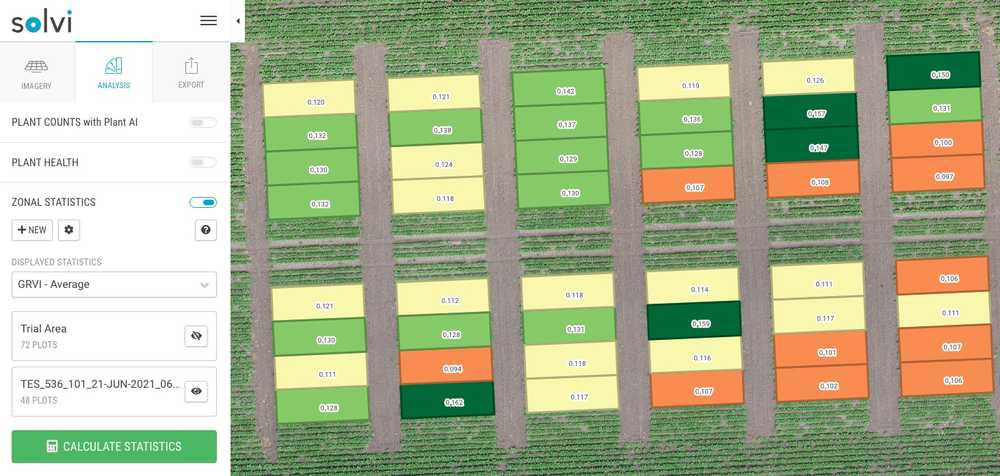
Using Solvi’s Zonal Statistics, NBR is now able to easily identify each trial plot and use the visual maps to inspect and document trial outcomes.
“We have expanded our data management and analysis systems to incorporate the results of data analysis in Solvi. And it has allowed us to overlay our trial outcomes and get fantastic visuals of the results.”
2. Plant Counts
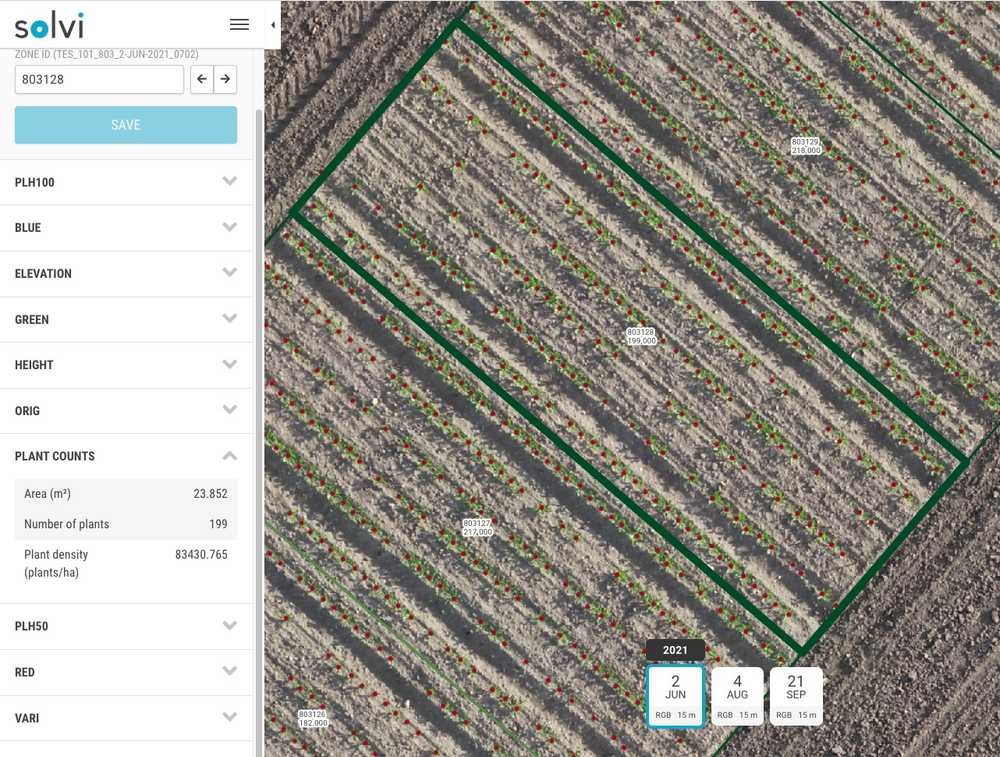
Solvi’s Plant Counts feature provides a nearly instantaneous assessment of plant numbers in each plot. The Plant AI algorithm allows them to measure plant-level data like size and canopy cover as well. But in research, even the technology is scrutinized.
We have tested the drone images to assess plant numbers, size and canopy cover. The count of final numbers of plants seems very reliable, but we still use the manual counts - we need a few more years of data on this before we know the drone is truly as reliable as the human, English said.
From the thousands of images they’ve captured, NBR researchers are learning some key windows for use of the PlantAI algorithms in their crops.
It seems that there is an optimum time to capture the images too - just before the plants grow together within a row. I think the SOLVI AI system can handle the images when the plants have grown together, but it’s more difficult for the operator to tag the images once plants start to grow together.
3. Plant Health Maps
NBR is experimenting with various types of drone data to bolster their trial data, but even without expensive multispectral cameras, they find great value in their drone surveys with a simple RGB setup.
“We have expanded our data management and analysis system to incorporate the results of data analysis in Solvi,” English said. “Canopy cover is now a variable we are considering given it is economic (basically zero marginal cost). Solvi allows us to send the results of our trials back to the Solvi platform so that we get fantastic visuals of the distribution of results.”
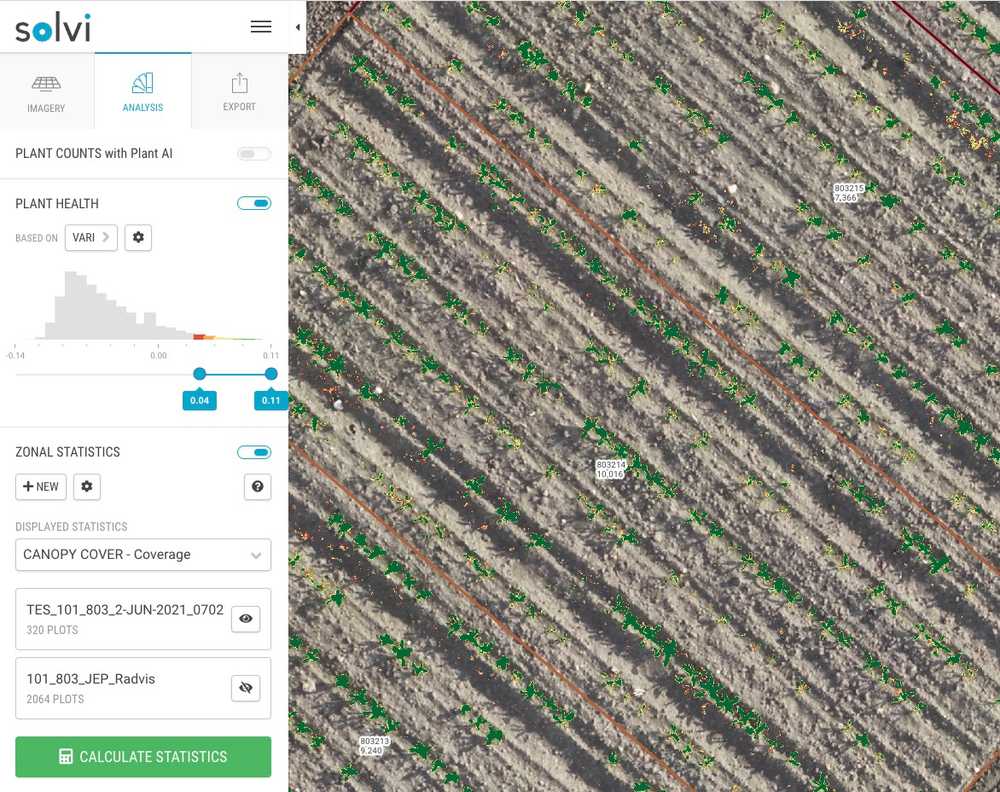
A communication follow-up for an ongoing research project, this 2020 micronutrient study uses drone imagery to complement satellite-based NDVI measurements and begin building a database for analysis. In the meantime, images are presented for reporting clarity and reference.
Drone Survey Outcomes
- Standardized, replicable field inspections and yearly results cataloging
- Quantitative data sets for in-season and multi-season comparisons
- Keen visual observations of minute field variations
- Simple, clutter-free image processing and storage
- Improved data confidence for variety selection and recommendations
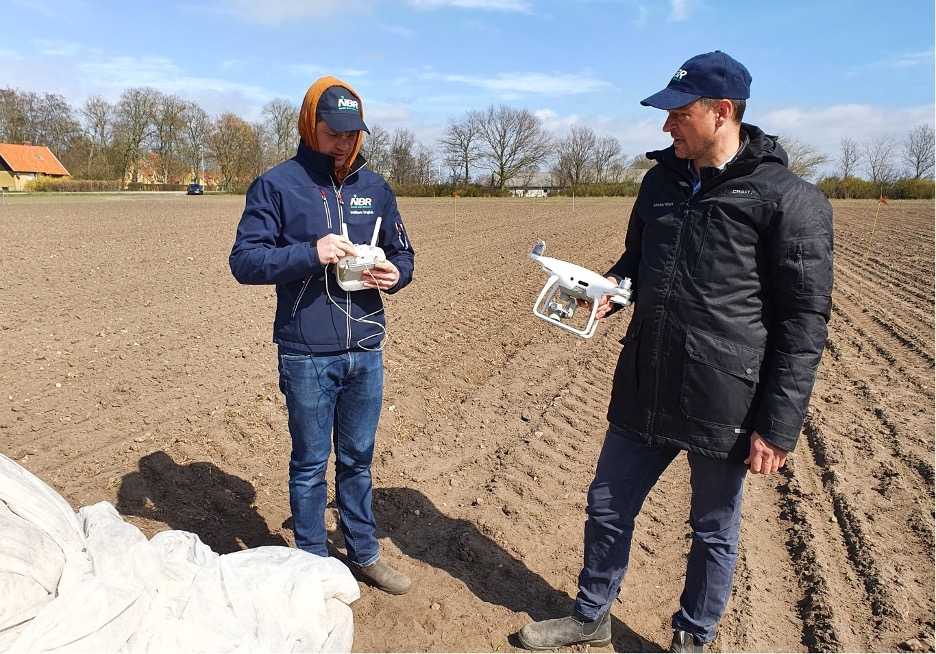
One unexpected benefit of the drone surveys has been an expanded, up-leveled role of their research technicians who not only handle daily plot management but now also pilot their drones.
The future role of the research technician will likely involve a lot more phenotyping robot operation and a lot less actual assessment (counting).
Expanding the role of technology in agriculture benefits human opportunity in addition to agronomics.
Future Plans
As NBR’s research data inputs expand, they foresee expanding their analytics use, particularly testing spectral imagery.
Data confidence is the tangible improvement we have realized with drone imagery. From the experiences we have had to date, images will likely play an increased role in communications, especially with those who are closely invested with the research, and in reducing the costs of the work,” English said. “In total, drone work is less than 1% of the total work in this research, but very valuable. This is the future arriving.
Benefits of Solvi Analytics
Standardized Research Plot Comparisons
With multiple collaborators and a dispersed research team, standardized procedures and quantitative data capture are paramount for trustworthy results. And while mobile data coverage is rarely a problem at NBR’s field sites, they prefer offsite image transfer and hosting. Solvi’s offsite cloud-based processing allows NBR to keep their digital desktops clear and easily transfer field imagery and analytics.
- Complete all in one cloud-based platform. No 3rd party software needed.
- Flexible to work with any RGB or multispectral camera and drone combination.
- Simple four-step imagery upload process.
- Highly accurate plant counts and health analytics.
- Clear, visual plot boundary maps and data results for research reports.
- Easy online file sharing for full team access.
- Fast 30-60 minute image processing for immediate analysis.
We probably save a little money and a good amount of time from Solvi’s analytics,” English said. “But where we really gain is in the trust we have in our decisions and our data management processes. We definitely plan on continuing with Solvi for the foreseeable future.
