How SLU researchers use drones to develop large-scale models for Variable Nitrogen Rates in Winter Wheat
January 31, 2023
Winter wheat is a globally important crop both for premium bread wheat and fodder. Optimizing nitrogen rates and application timing through precision agriculture can significantly impact wheat growers’ profits through input savings and improvements in yield quantity and grain quality.
Developing reliable models to guide growers on in-season nitrogen management decisions is extremely valuable to farm profitability and environmental quality.
However, nitrogen use efficiency in cereals is low, estimated at only 33% on a global scale. Because nitrogen requirements vary within fields and between seasons, vegetation indices from UAV imagery can provide an immediate assessment and prescriptive tool.
The Swedish University of Agricultural Sciences (SLU) is an international university - one focus area is environmental preservation and sustainable food production. To make precision agriculture more accessible, SLU is developing models for decision support tools to aid growers in winter wheat fertility management. These ongoing projects are powered by drone sensor-based models.
The decision support systems that we develop are based on remote sensing data either from drones or satellites depending on what technology growers have,” said Mats Söderström, researcher at SLU. “We use drones for modeling data because satellite imagery doesn’t provide sufficient resolution for micro plot analysis of the trials. Another advantage of using drones is the almost immediate availability of the data. We could collect the imagery at the exact dates that we needed, even on cloudy days, and within a few hours be analyzing the data at the office.
Study Design
Partner: The Swedish University of Agricultural Sciences (SLU)
Crops: Winter wheat (6 N rates, 10 cultivars, 4 repetitions)
Location: 12 sites in main agricultural districts of southern Sweden
Research microplot size: 2m x 10m
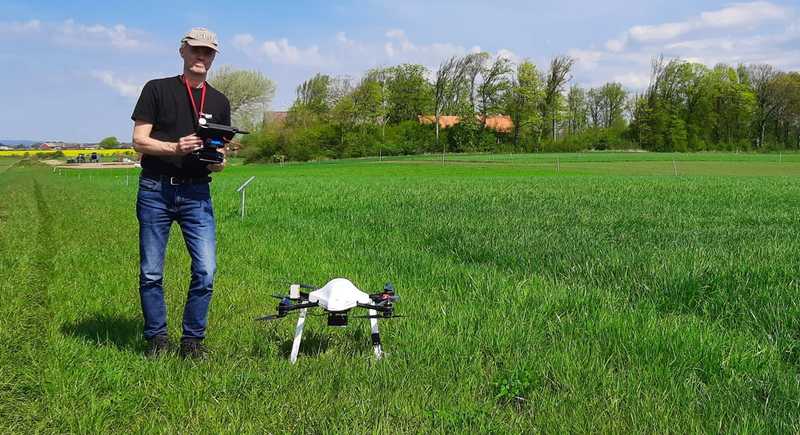
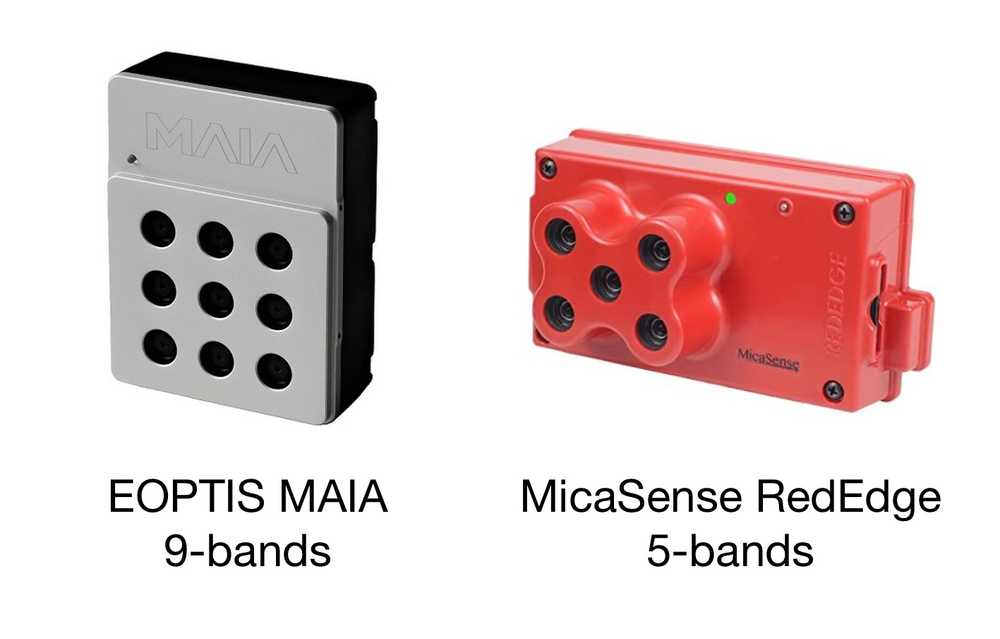
Hardware: Custom-built drone (Pitchup Explorian-8) equipped with two cameras, a nine-band MAIA-S2 (Eoptis Srl, Italy), and a five-band Micasense Rededge (AgEagle, USA)
Software: : Solvi’s automated cloud-based imagery stitching, Plant Health Crop Indices, Zonal Statistics
Flight Altitude: 80m AGL (Above Ground Level)
Number of flights: 3 per season per trial, a 3-year study
Image resolution: : ~ 3 cm/pixel
Situation
To sustainably intensify crop production, improving nitrogen use efficiency through precision agriculture is essential. However, the distribution of winter wheat’s nitrogen requirements and crude protein concentration varies substantially, but not always visibly, within fields and between seasons.
In-season variable rate nitrogen application poses an opportunity for growers to exploit yield potential, minimize the environmental impact of nitrogen leaching, and to achieve quality goals such as protein concentration. But blanket fertility recommendations are impractical. Nutrient optimization requires local adaptation. Understanding the existing soil-nitrogen load, current crop performance and seasonal yield potential is essential but constantly evolving.
To make precision nitrogen use practical, growers need timely, reliable in-season crop data and agronomic interpretation based on sound research.
Together with partner organizations, SLU has previously developed a Sentinel-2 satellite image-based decision support system (DSS) for precision agriculture called CropSAT. Their next goal is to combine this system with localized agronomic models that turn spectral data into easy-to-use decision-making tools for cereal farmers and advisors.
However, Sentinel-2’s imagery posed a series of problems:
- image resolution is too low to evaluate trial micro plots
- imagery can be unusable due to cloudy conditions
- image timing may not be available for all crop growth stages
SLU researchers opted for drone imagery to analyze wheat trial data and develop their agronomic models. Using a novel 9-band MAIA-S2 camera with the same wavelengths and widths as the Sentinel-2 satellites, they hoped to find spectral correlations and build a broadly functional tool.
SLU’s Research Goals
- Improve nitrogen fertilization recommendations from spectral data
- Investigate and compare plant health data for fertility needs at different crop stages (DC37 and later)
- Create predictive models for in-season N application rates from drone data and compare vegetation indices’ ability to predict optimal target N rate and remaining supplemental N rate
- Correlate drone vegetation indices with Sentinel-2 satellite data
- Create satellite-based decision support tools for variable rate nitrogen fertilization.
Research Strategy
SLU is conducting several studies to develop their decision support models. One focused on predicting the optimal target and in-season supplemental nitrogen needs has already been published.
In-Season Nitrogen Assessment & Need Prediction
This study evaluated the baseline soil nitrogen level, an optimal nitrogen target, and the relative remaining nitrogen need to calculate an in-season nitrogen rate.
Researchers compared 16 multispectral and 4 RGB vegetation indices (including a proposed custom index) for each plot to evaluate and predict the crop’s total nitrogen target and remaining relative nitrogen need.
Various vegetation indices describe specific features of the spectral signature of the crop. Individually, or in combination, they may have different abilities to describe the status of the crop canopy for the purpose of nitrogen requirement,” Söderström said. “We compared numerous indices to identify the most reliable performance for multiple locations and growth stages. Choosing the right index for this support tool was critical as it drives all outputs.
RGB Indices
- TGI - Triangular greenness index
- NGRDI - Normalized difference vegetation index
- GLI - Green leaf index
- VARI - Visual Atmospheric Resistance Index
Multispectral Indices
- NDVI - Normalized difference vegetation index
- NDRE - Normalized difference red-edge index
- ChlI - Chlorophyll index (based on bands 7&6)
- MSAVI2 - Modified soil-adjusted vegetation index
- OSAVI - Optimized soil-adjusted vegetation index
- REIP - Red-edge inflexion point
- TCARI - Transformed chlorophyll absorption in reflectance index
- TCOS - Calculation of TCARI/OSAVI
- Several other proposed custom indices
Using predictive nitrogen modeling, researchers weighed the nature and design of a variable nitrogen rate application decision support tool.
Download The Complete UAV Handbook for Agricultural Research
Learn how to establish a successful drone imaging program without a data scientist
Get your free pdfDrone Analytics Tools
1. Field Orthomosaic Maps
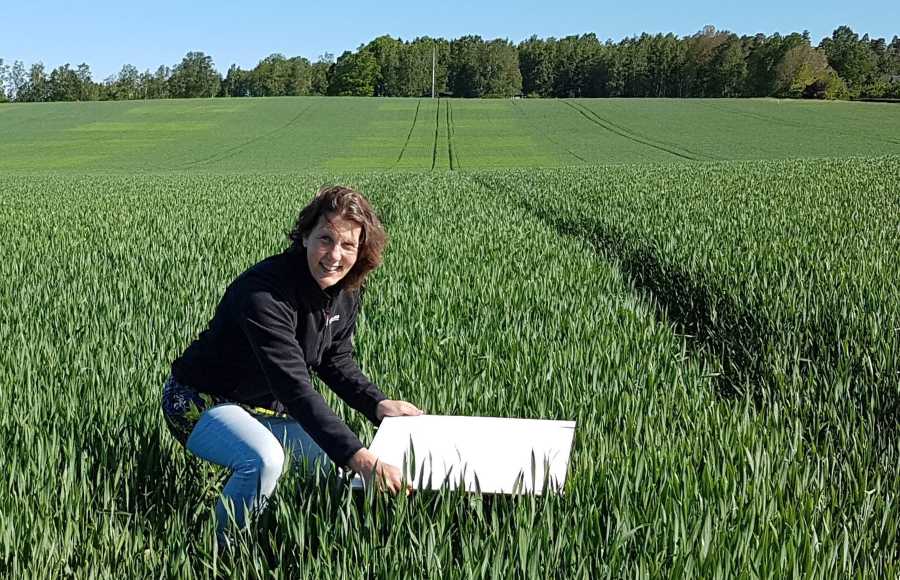
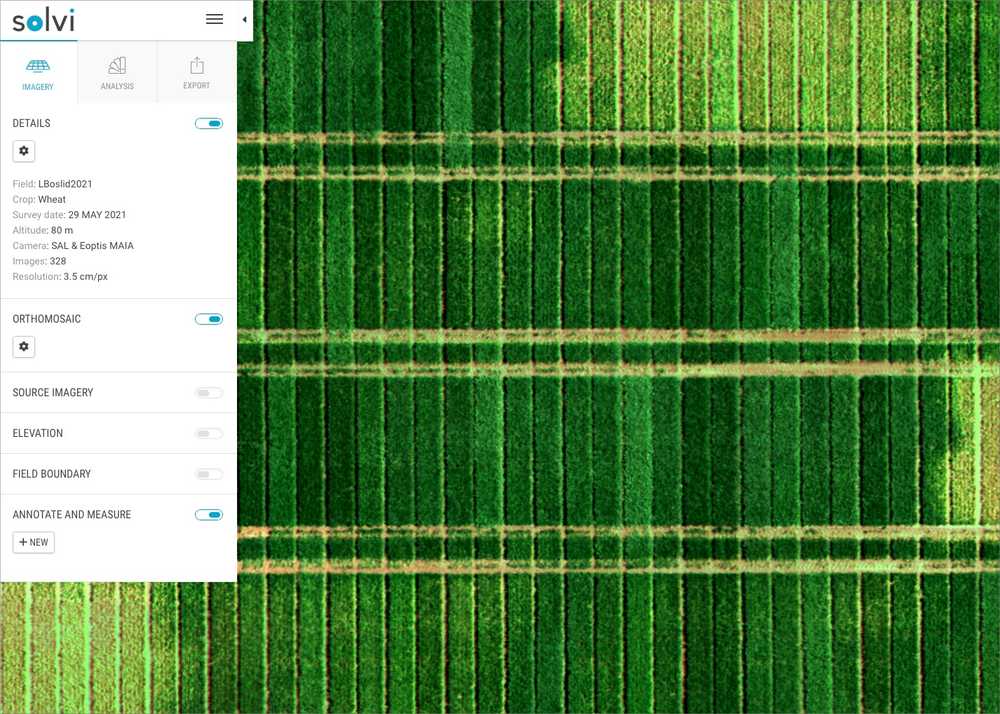
Researchers used stitched trial plot imagery to digitally recreate research plot fields in an orthomosaic map. This allowed them to visually inspect and compare field plots and prepare for data analyses. For the MAIA-S2 sensor, SLU used EOPTIS’ proprietary software for radiometric calibration. For the MicaSense sensors, an established workflow that makes use of a reflectance panel and sunshine sensor (DLS) was used.
2. Microplot Extraction
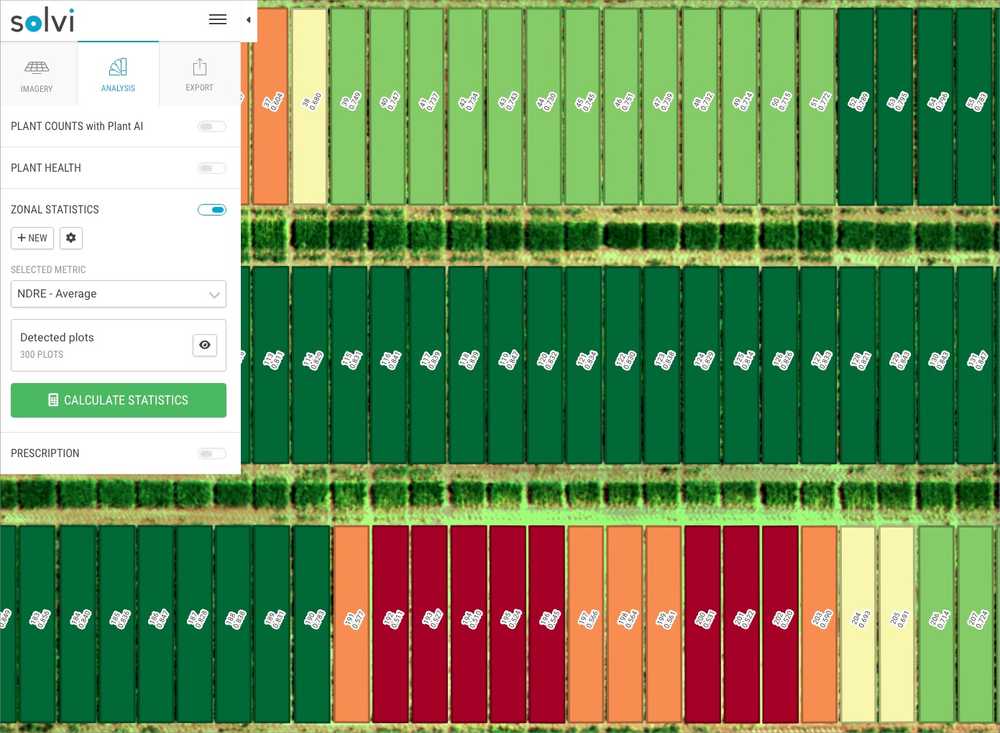
Since each of the numerous trial plots required individual analysis and comparison, researchers needed to isolate and extract data from each plot. The small size but the large quantity of trial plots can make this cumbersome in some applications. SLU used Trial Plot Creation tools to digitize plot boundaries and export them as a SHP-file.
3. Plant Health
With each microplot extracted, researchers could quickly characterize plant health based on various vegetation indices. The study compared 16 indices over space and time (including custom indices) and validated them via lab tissue testing.
4. Data Export
SLU, like many researchers, wanted to dive deeper into their drone image data and perform their own custom-coded analyses. Exporting geocoded plot data in both raster (GeoTIFF) and vector formats (SHP files) allowed for statistical modeling and to execute R-scripts for highly specialized investigations.
Research Outcomes
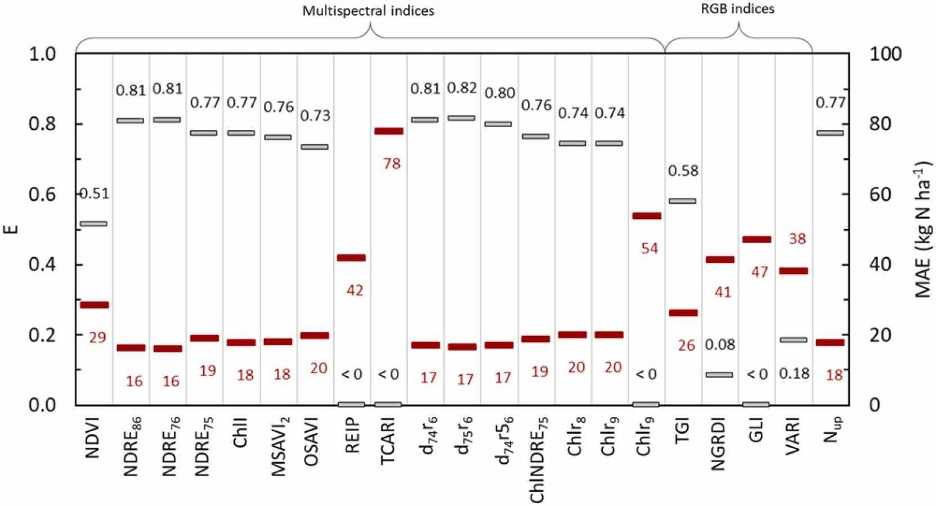
The research showed that predicting optimal N for new sites and years in winter wheat using drone-based vegetation indices is possible. It also showed that the multispectral indices performed better than RGB indices.
Triangular greenness index (TGI) was the best RGB performer (better than other three NGRDI, GLI, VARI), probably because of sensitivity to canopy chlorophyll content and insensitivity to leaf area index
Several multispectral indices performed well (NDRE, MSAVI2, new custom indices). All used Red edge - NIR region. Commonly used NDVI did not perform as well
Making these decision support tools widely available will empower Swedish wheat growers to adapt nitrogen management best practices to their location and conditions,” Söderström said. “This type of precision nutrient use creates a flexible, sustainable agricultural system – saving farmers on input costs, optimizing crop nitrogen timing, and minimizing environmental impact.
Future Work
The project was successful on several fronts but uncovered challenges to be addressed in future efforts, including national field trials to calibrate the agronomic models and model adaptation to measurement variables of lighting, soil reflectance, sensors, and platforms.
Collecting large quantities of spectral data from drones during several years, and with the intention that data both within an individual flight, and between flights, shall be comparable – that is certainly a challenge,” Söderström said. “We need cameras and procedures that make a complicated workflow seamless. Solvi does just that.
Benefits of Solvi Drone Crop Mapping and Analytics
Plot-Level Data for Cereal Crops
Agronomic researchers need data tools that work for the crops, timing and scale of their trials. Like many field researchers, SLU uses trial micro plots that are too small for satellite imagery to render precision data. Drone imagery offers a precise and adaptable data source for their highly detailed investigations.
Solvi’s one-stop drone image stitching and analytics platform streamlines drone data workflow and simplifies plot analytics with tools designed by and for agricultural researchers.
- Complete all in one cloud-based platform. No 3rd party software needed.
- Flexible to work with any RGB or multispectral camera and drone combination.
- Simple four-step imagery upload process.
- Highly accurate plant counts and health analytics.
- Easy-to-use Zonal Statistics tool for quick extraction of plot boundaries.
- Clear, visual plot boundary maps and data results for research reports.
- Easy online file sharing for full team access.
- Fast 30-60 minute image processing for immediate analysis.
For us, Solvi is an effective service that facilitates our use of drone images, so we can focus more on the analysis and less on handling all the images,” said Mats Söderström, SLU.
Additional Resources
More about the project:
Piikki K., Söderström M, Stadig H. 2022. Remote sensing and on-farm experiments for determining in-season nitrogen rates in winter wheat – Options for implementation, model accuracy and remaining challenges Field Crops Research 289: 108742
