#case study
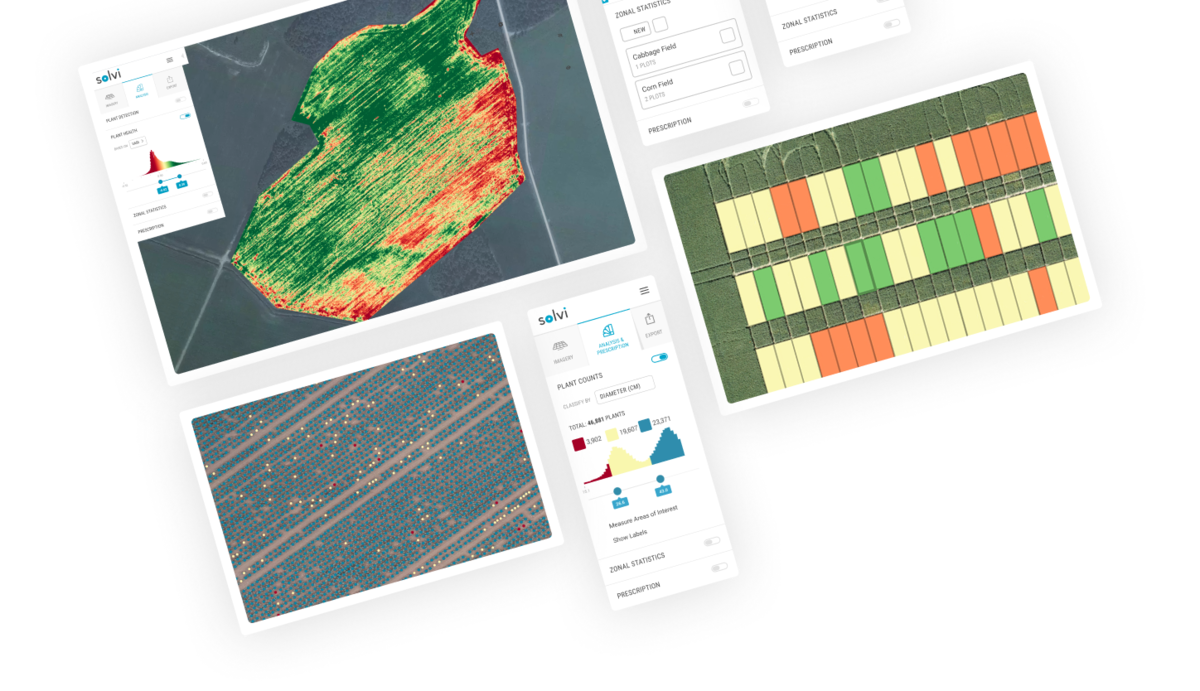
#plant counts


Learn how to establish a successful drone imaging program without a data scientist
Get your free pdf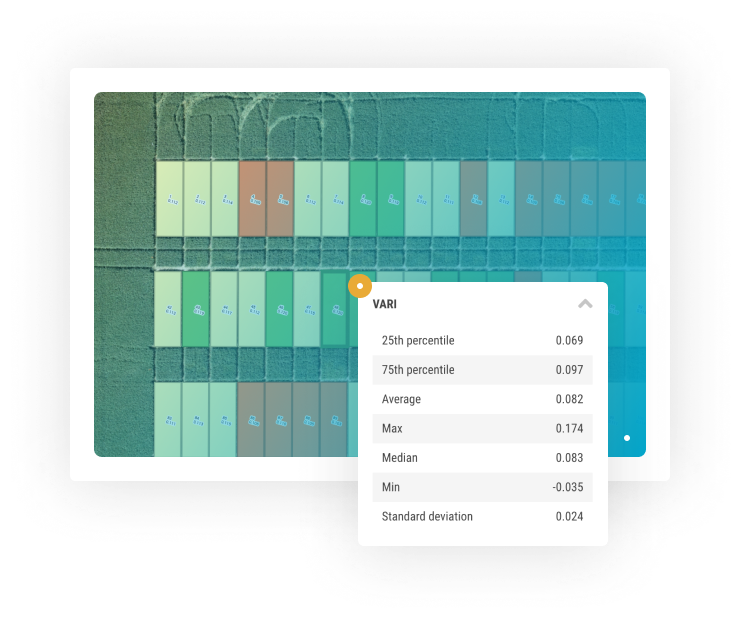
No more countless hours spent in the field. Collect objective data for the whole field trial in a single drone flight. Digitize plot boundaries and extract plot-level metrics in a few clicks.
“We probably save a little money and a good amount of time from Solvi’s analytics. But where we really gain is in the trust we have in our decisions and our data management processes. We definitely plan on continuing with Solvi for the foreseeable future.”William English
Project Manager & Industrial Doctoral Candidate at NBR Nordic Beet Research Foundation

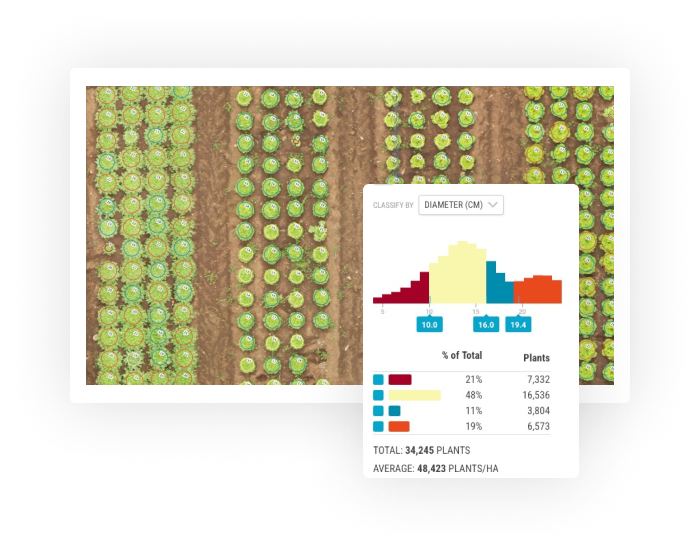
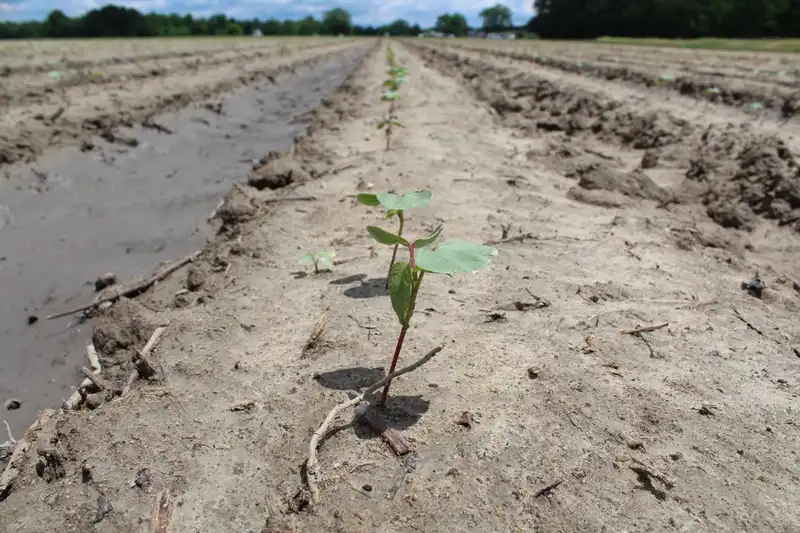
Powered by advanced machine-learning algorithms, PlantAI™ adapts to virtually any crop. Train your own crop-specific models in a few clicks to get the most accurate plant counts and plant-level data.
“We are amazed that Solvi’s PlantAI™ detection model is robust enough to work on different crop types from seedlings to crops to fruits, with relatively little labeling required. Solvi is very easy for a new user to quickly pick up. And the user-support experience from Solvi is the best by far for all SaaS solutions we have used in the past.”Mike Poodt
Team Leader Information Management R&D at Rijk Zwaan

Whether you manage a few local trials or thousands around the world, Solvi helps standardize data management and analysis at any scale.
Solvi makes image analysis and data management much more efficient and streamlines the whole workflow. It really changes the way researchers work with field trials.”Mats Söderström
Researcher at Swedish University of Agriculture

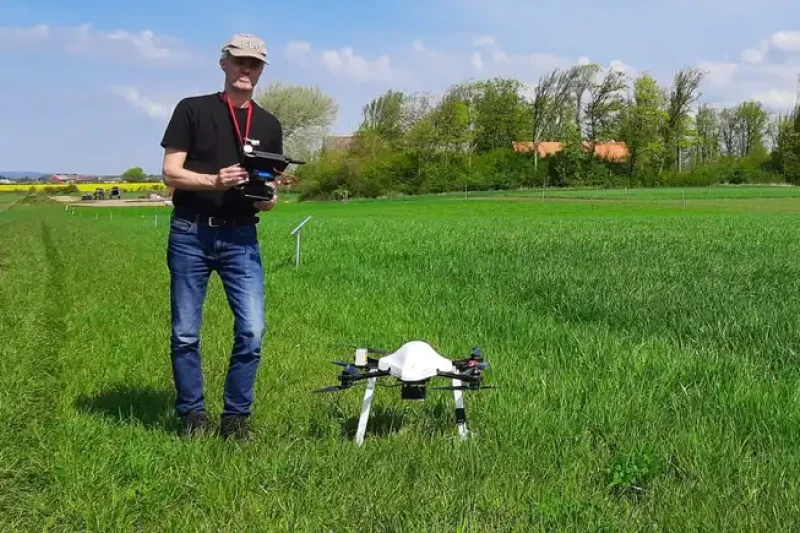
Collect imagery whenever you need with any drone and camera, and upload it to Solvi. We support most sensors available on the market, both RGB and multispectral.
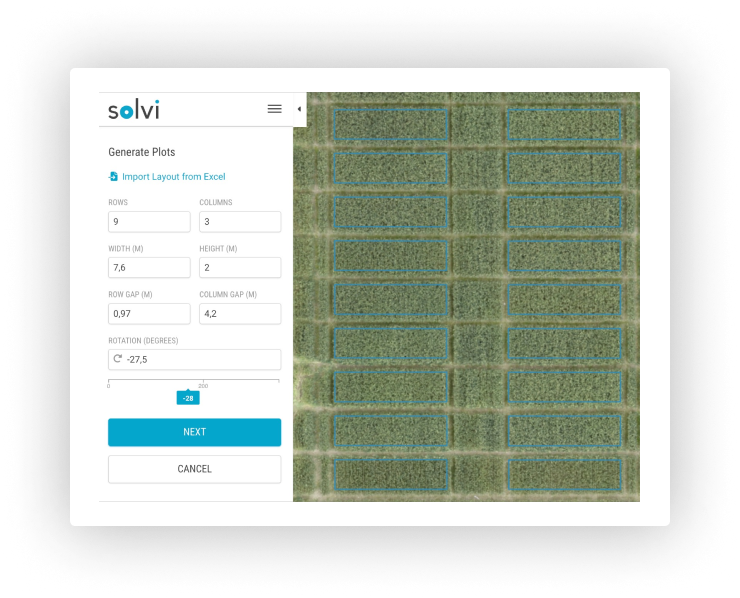
Get imagery processed into accurate maps, usually within 30-60 minutes. Use Trial Plot Creation tools to digitize plot boundaries and calculate plot-level metrics in a few clicks.

Review calculated statistics on an interactive map, classify plots by any metric and compare plot performance over time.

Download the statistics in CSV or SHP formats for further analysis, or access data via API for more automated workflows.