We’ve just released a new feature in Solvi that gives you full control over which vegetation indices you use.
Until now, Solvi came with 10 default indices. If you needed something else, our team had to add it manually. That worked, but it wasn’t ideal.
With the new Index Library (available in the top menu), you can now:
• Browse 50+ additional indices and add any of them to your account with a single click
• Create completely custom indices from scratch by entering a name and formula
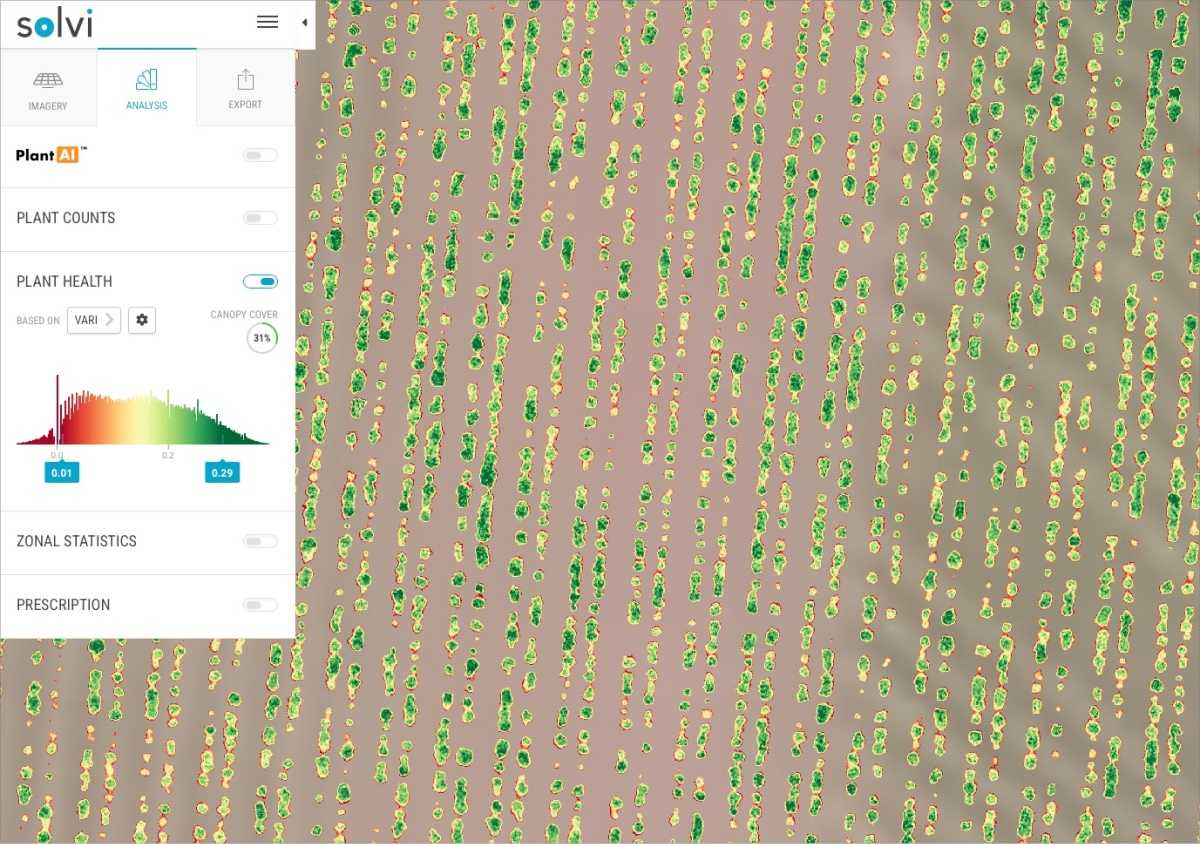
• Use your indices across all tools, Plant Health maps, Zonal Statistics, and PlantAI
Creating a custom index is simple. Just type in the formula using band variables (R for red, N for NIR, E for red edge, G for green), and it’s validated instantly with a live preview on the map.
Any index you add is saved to your account, so your whole team can use it too. Index Library is available to Professional and Enterprise plan users.
Curious to see how it works? Watch the video below 👇